How is GDP measured?
(All information is taken from NIPA Handbook: Concepts and Methods of the U.S. National Income and Product Accounts, November 2017, and all in-text citations refer to the same)

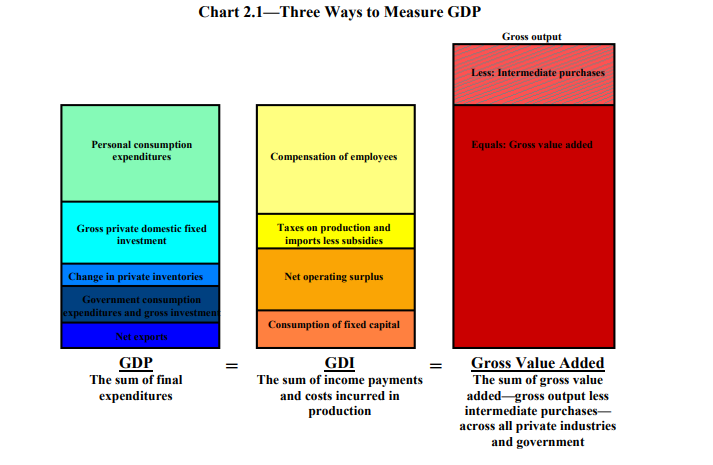
GDP is defined as “the market value of the goods, services, and structures produced by the economy in a given period” (Handbook, 2–7). This can be measured three ways:
- The sum of all goods and services sold to end users (the expenditures approach)
- The sum of all costs incurred in producing goods and services (the income approach)
- The sum of “value-added” from each industry (the production approach).
Summarized graphically:
The Bureau of Economic Analysis (BEA), which is responsible for measuring GDP, does so using all three methods, although generally the first is accepted as more accurate. They collect a lot more information than just what’s needed to calculate GDP, but we are going to ignore all of that and focus only on the central question — how do they actually measure GDP?
This is a complicated question, but one that can be answered in great detail with a lot of clarity by reading the NIPA Handbook. Don’t worry about what NIPA stands for —I have no idea, and I still understood what was going on. It’s some sort of collection of economic information, I think. All the following information is a summary of that handbook. Anyway…
Data Inputs

Let us imagine the economists preparing the GDP figures for the month of February (the BEA prepares monthly, quarterly, yearly, and quinquennial (!!) estimates, which it revises many times, using more comprehensive information each time. It’s complicated). So, they are preparing for the month of January, standing around a bubbling cauldron labeled “economic analysis”. Each economist utters a mysterious phrase before throwing in an ingredient. Here are some of what they include:
- Census data: Just like the demographic census, the U.S. Census Bureau also collects information on companies. Some of these censuses are “mandatory” which I think means that the companies have to fill them out, but I’m not sure. Others are voluntary. In general, these censuses seem to target all large businesses over a certain size (left unspecified), and then a representative sample of smaller businesses, with some statistical modeling to add in even smaller businesses, like single-person business. In some cases, the surveyed sample is “selected” — by whom, or on what grounds, I don’t know. This is a big chunk of the inputs.
- Government financial data: The BEA has much better access to federal and state government agencies’ financial data than they do to that of private companies, so instead of relying on survey data, they just look at the source. They also use a “representative sample” of local governments.
- Other random government and non-government organizations: Anything farming-related is collected by the Bureau of Agriculture, employment information by the Bureau of Labor Statistics, retirement information by the Social Security administration (except for employees of railroads, which have a Railroad Retirement Board)… There are a lot. If you really want to know what information comes from where, look at the Handbook. There are also many trade organizations that collect data about a specific sector of the economy. I don’t know how they decide what organizations are trustworthy, and which are not. For that matter, how do they decide if other governmental organizations are trustworthy? If someone at the BEA thinks about such things, I am sure they would not write them down in publicly accessible documents.
- CPI data: To do their analysis, the BEA needs to know about inflation. The general technique for measuring inflation is to create a representative bundle of goods and track its price over time (adjusting for changes in quality)(also only in urban environments, for unspecified reasons). This is called the consumer price index (CPI). However, there’s not just one inflation rate, but rather many of them, there are many different bundles of good, focused on various types of goods and services including: new cars, old cars, furniture and bedding, computers, and tires. There are a LOT of them. This information is collected by the BLS.
Data Processing

Once the ingredients have been added to the cauldron, each economist steps forward, dips a stirring spoon into the concoction and executes a complicated series of motions. This is some of the processing they do:
- Processing to change definitions: “Internal Revenue Service data from corporate tax returns include estimates of depreciation, but these estimates are based on historical-cost valuation and on tax service lives. BEA must adjust these estimates to the NIPA definition of depreciation — consumption of fixed capital — which is based on current-cost valuation and economic service lives” (Handbook, 4–1). It doesn’t matter what this actually means, but I hope you get the picture.
- Filling gaps in coverage: The BEA uses fancy statistical tools to extrapolate and interpolate to fill in gaps in their data. I assume they are fancy statistical tools, but here’s a sample quote from NIPA Handbook, 4–8:
Currently, BEA is using a procedure known as the “proportional Denton method” or “quadratic minimization.” In its most common application, this approach interpolates series by minimizing the sum of the squared differences of the ratios of the interpolated series and the indicator series. This sounds like a fancy way of saying “slightly modified least-squares”, so… I have some doubts. Nonetheless, there are a lot of specialized models used in specific cases, and I won’t get into them here. The specifics are important, though — they really do affect the outcome. Examples include seasonal adjustment, smoothing with moving averages, and “commodity flow” methods.
- Adjusting time of recording and valuation: I don’t really understand this category, but it has to do with imports and exports, and adjusting when/where the estimates of value were made.
- Common-sense processing: If your statistics for the month of January were taking during the day of a massive snowstorm, your results are probably not representative. Somebody needs to figure out how to fix it.
Final Thoughts

The ritual is complete — the GDP numbers have been brought into being. But how can we be sure, after all this processing, that this number has any meaning? For example — the BEA treats people who own a house as if they are renting a house to themselves, so that GDP will not change depending on if people are renting vs. buying. Reasonable? Sure. But they don’t do the same thing for providing childcare for your own children vs. taking them to a small family daycare. Reasonable? I don’t know.
The point, however, is that despite the potential flaws in GDP, people have still been able to treat it as a useful indicator, and found that it correlates with many things we care about (life expectancy, quality of life, political freedom, etc.).
Does this mean that it’s dangerous to optimize for GDP growth over all else, because of the gap between what we really want and what it measures? Maybe. But I would hesitate to make that argument until after looking into the details, and then only about a specific case. At my current level of understanding, I don’t feel qualified to make such a judgement, but I would feel qualified to ask someone who should know and see if they have a reasonable answer.